
Profile pages
200+ Company Profile Pages
Strengths, weaknesses, and the analysis you need to know
Research
Research & Analysis library
Institutional-style notes, saved and refreshed
Weekly
The Weekly Update
Every covered company retested, every week
Guides
Interactive guides & calculators
Free to everyone, member or not
One profile page.
Two layers of research.
The company page brings the data and the written analysis together. Move between the live profile and the equity research note to see what each layer contains.
Explore the Profile Page
Explore the Equity Research Note
Visuals are captures of the live NVIDIA profile and its 26 August 2026 research note, taken 13 October 2026. Figures shown are point-in-time examples. Informational research, not a recommendation.
Each profile must answer three questions.
01
What matters?
The numbers, claims and risks that carry the most weight, not every fact that happened to be published.
02
What changed?
A dated comparison with the standing case, earlier editions and the market expectation.
03
What comes next?
Observable events and explicit watch items that can strengthen, weaken or overturn the thesis.
Every strength. Every weakness. Both on the record.
Every week the standing case on every company in a 198 company universe is retested against fresh evidence: what was reported, what management claimed, what the market merely believes. Each finding goes onto the profile page as a dated desk point, a reward or a risk, and every checkpoint we name is scored in the open when it lands. Both sides of every story, never a recommendation.
Our Mission
Institutional-quality analysis, available to everyone.
The Process
Everything we do here passes through the same disciplined process. From primary filings, through verification and analysis, to a published document with sources you can trust & trace. Most research operations keep this part hidden. We publish it because we’re proud of our work.
Every note we publish has been put through this rigorous process.
We do not believe knowledge should be gatekept.
Invest Informatics was created by a team of professionals with decades of collective industry experience who wanted to share the work, explain the process, and show how serious investment analysis is actually done.
We’ll show the good, the bad and the ugly, unpacking the data, showing you what’s important.
NVIDIA Corporation · NVDA · Q2 FY27
Find the Signal
Both sides of every company, point by point, kept current and never deleted.
What changes for you
What we do for you and what you’ll be able to do.
The financial world rewards those who understand it. Most people are taught just enough to need help and then sold the help. We do the research, and we teach you everything!
Research notes rebuilt around signals.
The redesigned R&A format puts what matters up front: verified financials, recent broker actions with named sources and dates, valuation context, and the events worth monitoring. All the data you will ever need.
A Weekly Update that keeps you on top of developments.
What moved, why it moved, and what to watch next. One regular briefing so you’re never catching up on last week’s market.
Coverage of private companies before they hit the ticker.
Fifteen of the most consequential pre-IPO names on our Venture Capital coverage board, the companies shaping the next decade.
Financial tools built into every guide.
Options calculators, cryptocurrency calculators, and more. Working tools inside our Interactive Guides, so you can test the numbers yourself instead of taking anyone’s word for them.
A living library · nothing gets deleted.
Old research notes aren’t retired, they’re carried forward. The full workings, past and present stay available to you, so you can see how a thesis developed, not just where it ended up.
Read a 10-K and know which sections actually move the price.
Most annual reports run 200+ pages. A handful do the real work. Know which ones, why, and what to look for in each.
Tell the difference between earnings, cash flow, and the number the company wants you to look at.
“Adjusted EBITDA.” “Non-GAAP earnings.” “Underlying profit.” Each of these is a choice and each choice tells you something about how a company sees itself. Learn to read the choice, not just the number.
Build your own DCF model from a company’s filings line by line.
Not a template you fill in. A model you understand, can defend, and can adjust when the assumptions change.
Stress-test any investment thesis with bull, base, and bear scenarios.
The discipline that separates a position you can hold from one you panic out of. Probability weighted thinking applied to real names.
Build and defend an options position you can actually hold.
Instead of copy/pasting trade tips, learn the reasoning behind each strategy, when it’s appropriate, what the risk looks like, and what changes if the underlying moves against you.
We show you the signal in its truest form. The good, bad, or in between. No buy, no sell, no follow-up tip. The research is ours, the decision is yours.
Institutional-grade research, without the institutional price tag
Market commentary, research, and analysis at this depth typically sits behind expensive enterprise contracts. We don’t believe in that. Our work is priced well below competitor offerings. The goal is to inform and educate, not to gatekeep.
No advertising. Ever.
This is a paid site. No monetisation of your identity, no ads, no spam, no marketing from third parties. The only relationship between us and our subscribers is the subscription itself.
Independent by design.
Not FCA or SEC regulated. Educational and informational only. No commission, no kickbacks, no incentive to push you toward any product. The analysis stands or falls on its own merit.
Your data stays yours.
Robust encryption, no third-party tracking, no data sales. We hold what we need to keep your subscription working, nothing more. Everything else stays with you.
Interactive Guides & Financial Calculators
Step by step guides and interactive calculators that turn theory into practice, from reading your first research note to valuing a company to advanced strategy.
Start here: how our notes work
Walk through a real note one part at a time, using live pieces of one, so you know exactly what you are looking at.
Start the guide free →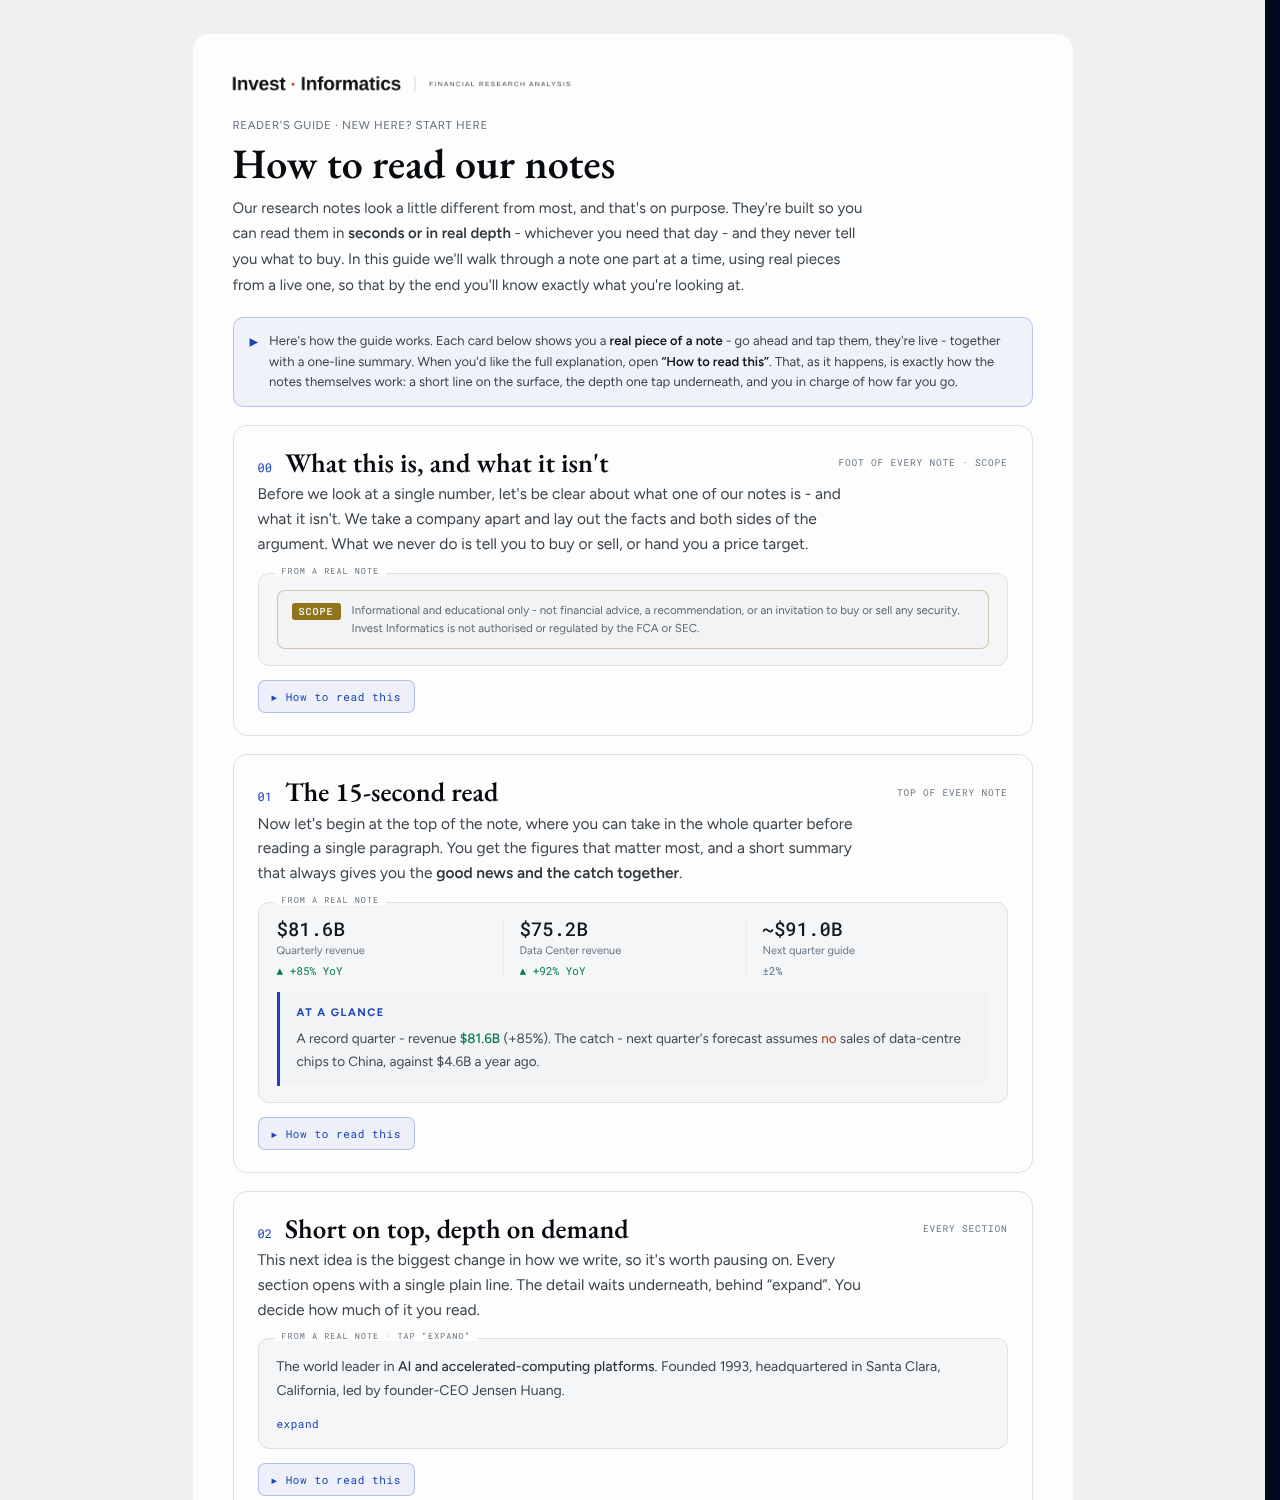 Free
Free
How to read a research note
Take a real note apart line by line. Valuation, risk, the language analysts use and what it hides.
Start the guide free →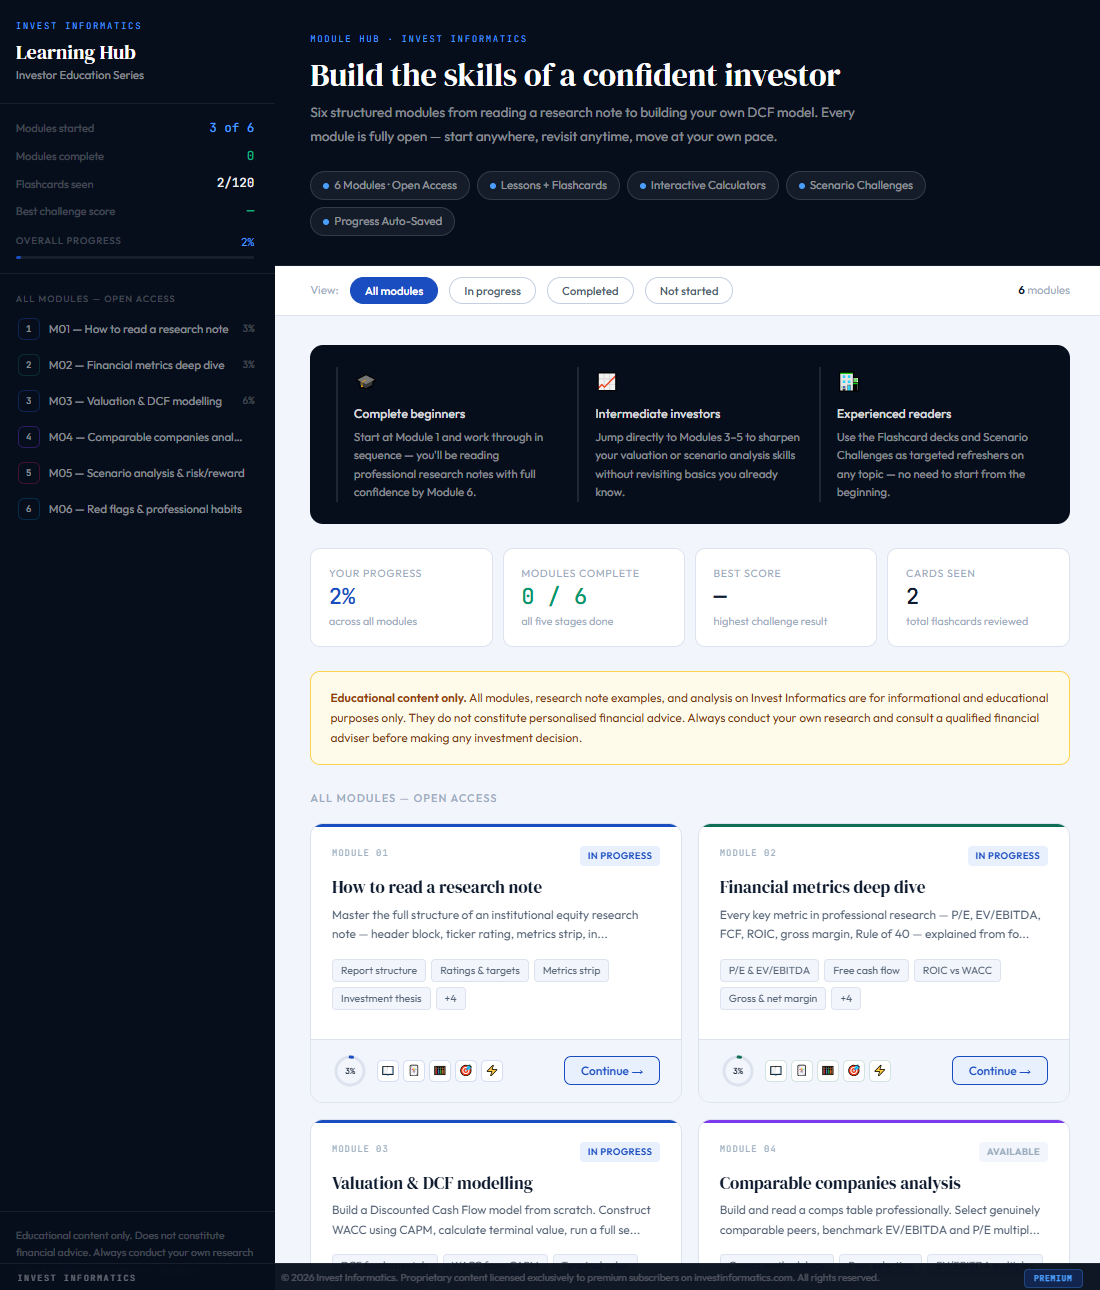 Free
Free
How stock analysis has changed
Run a live DCF, read a chart, drive a factor screen and build a tilt. Four methods, five sections, all of it hands on.
Start the guide free →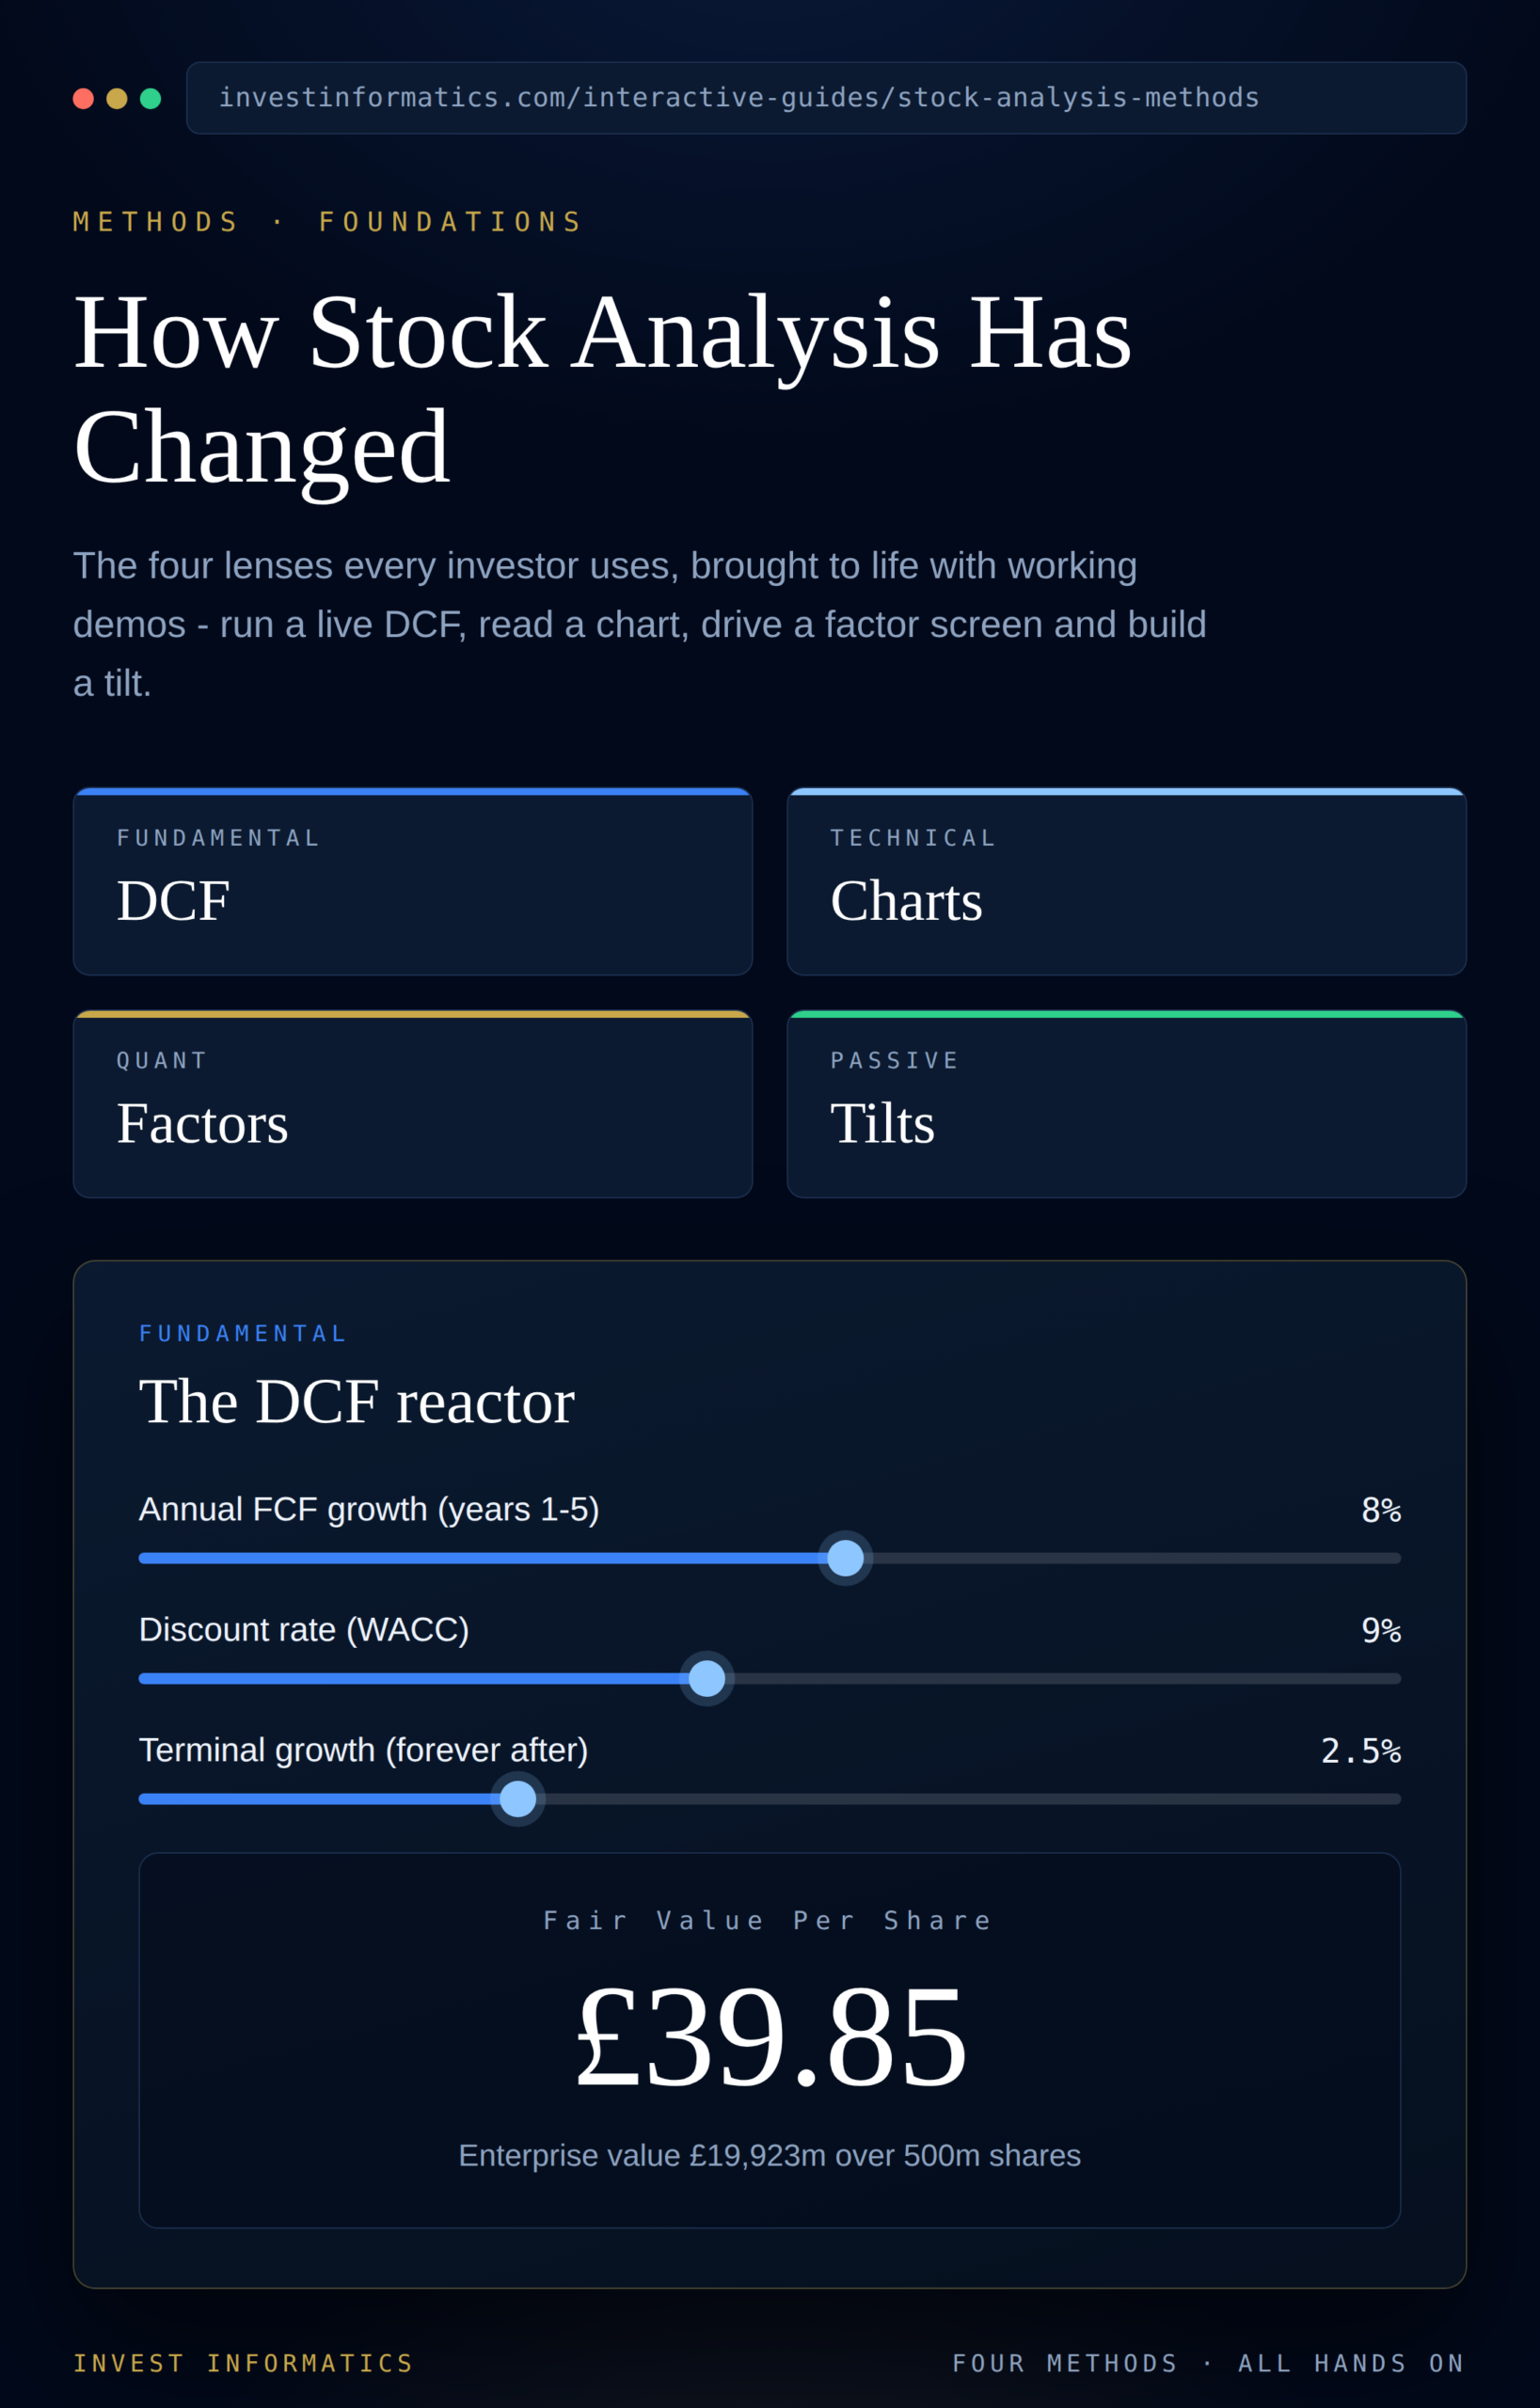 Free
Free
The complete guide to options trading
From first principles to advanced structures, with the tax treatment for each market spelled out.
Start the guide free →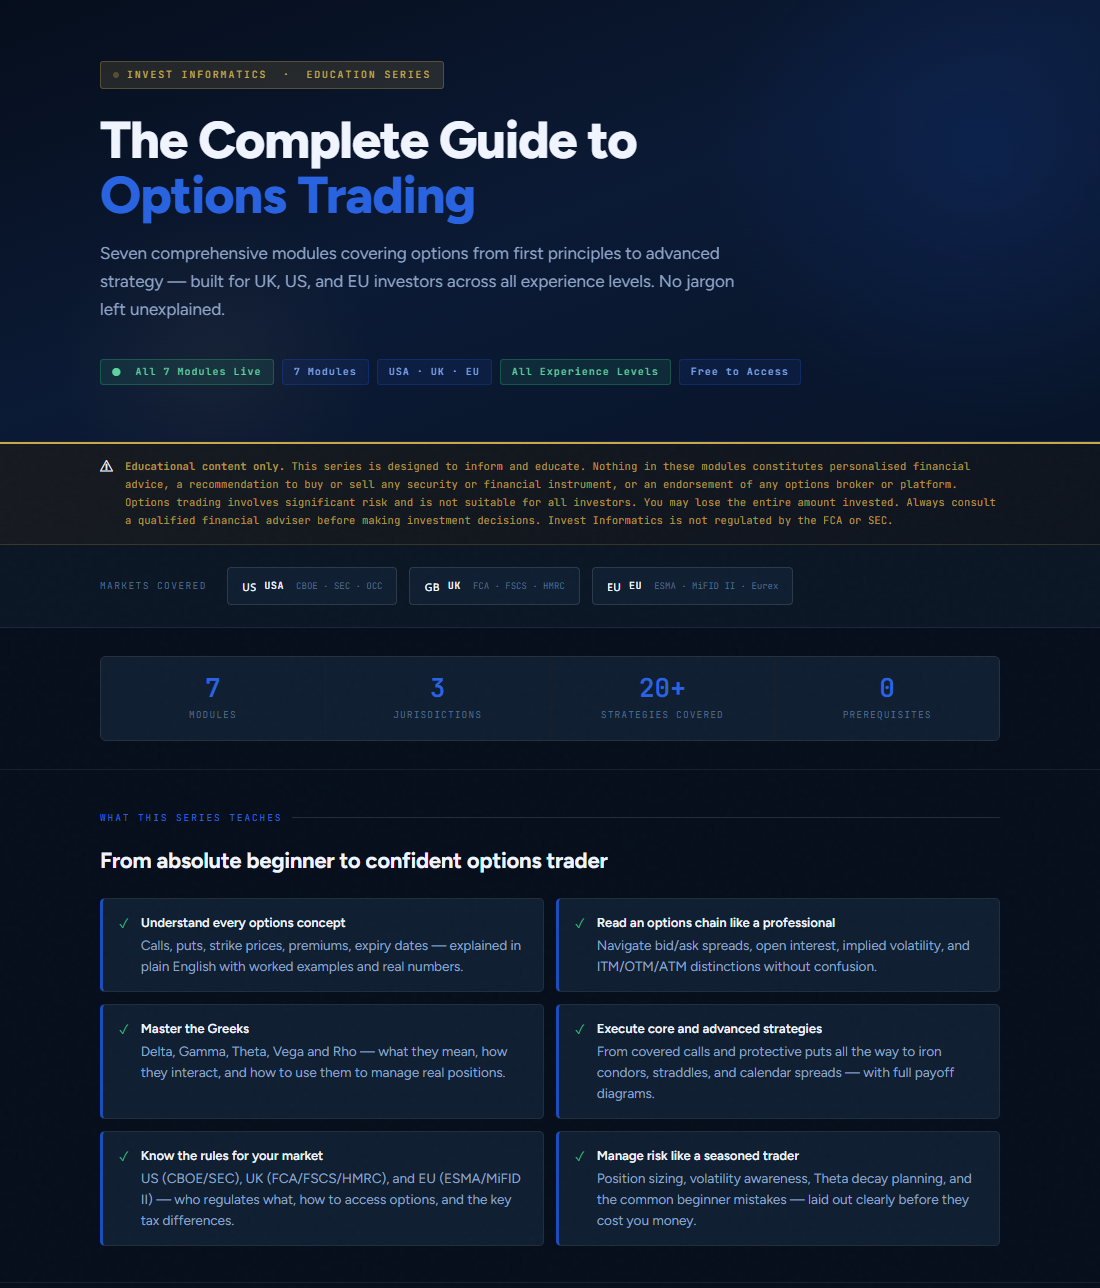 Free
Free
Cryptocurrency
No hype, no jargon. Follow a single payment through the system and see exactly what a blockchain is.
Start the guide free →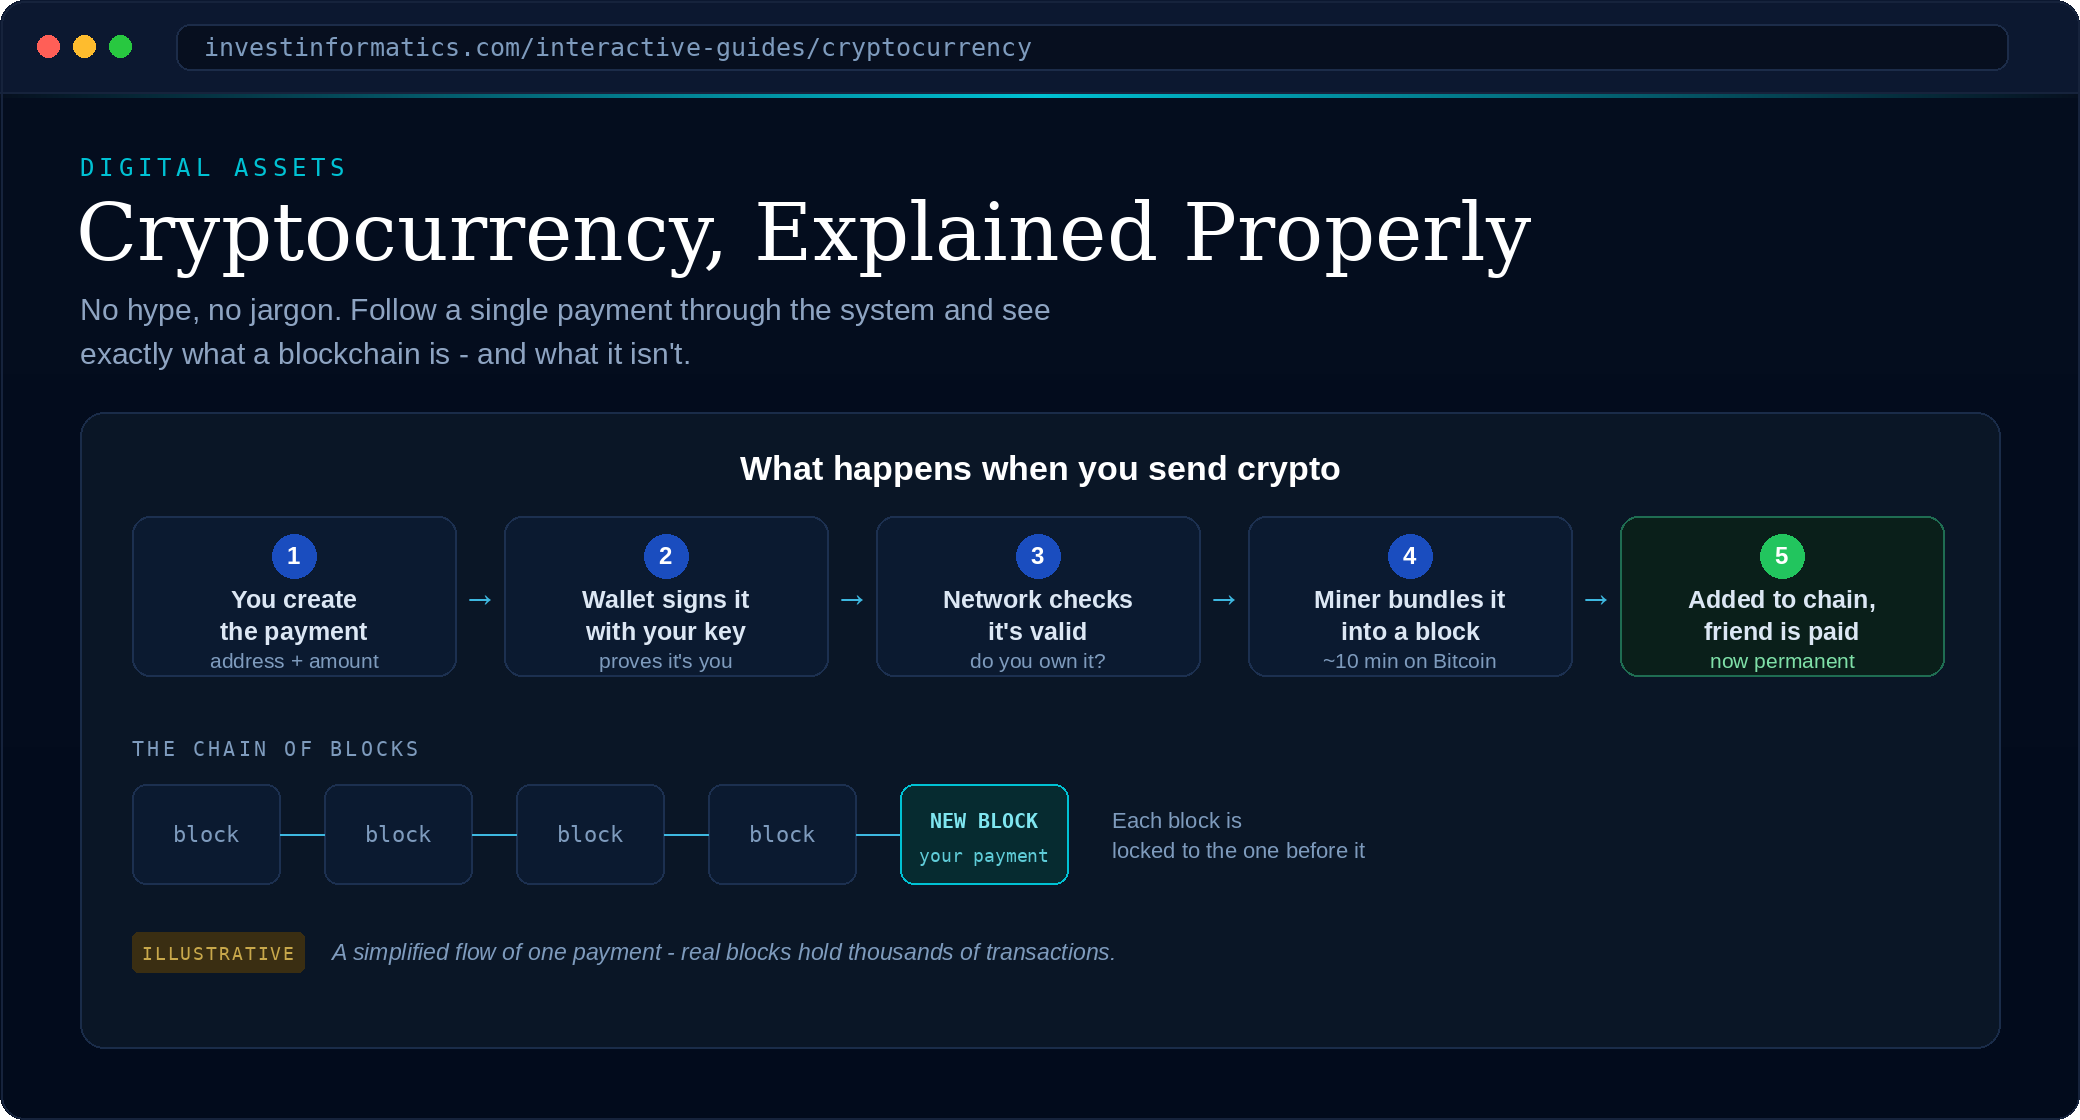 Free
Free
Ready to see the whole picture?
Cancel anytime·Every note, every update, everything in