
The full picture.
Bull vs Bear
Every company we cover carries two cases. We build both from the filings up, then show you where the weight falls. No recommendations and no house view, just the evidence on each side and what moved it this week.
Institutional Grade Equity
Research & Analysis
The financial world was made harder to understand than it needed to be. We built Invest Informatics to change that.
Created by experienced financial professionals with over 60 years of combined industry experience, Invest Informatics opens up the research process through institutional-style analysis, practical education, and tools designed to help serious Investors understand markets, risk, valuation, diversification and more.
A living library · A permanent record.
Over Two hundred profile pages across the UK, US and European markets, each one revisited every week. Here are six of them, the top of each page as it stands today. Less than 3% of what is inside.
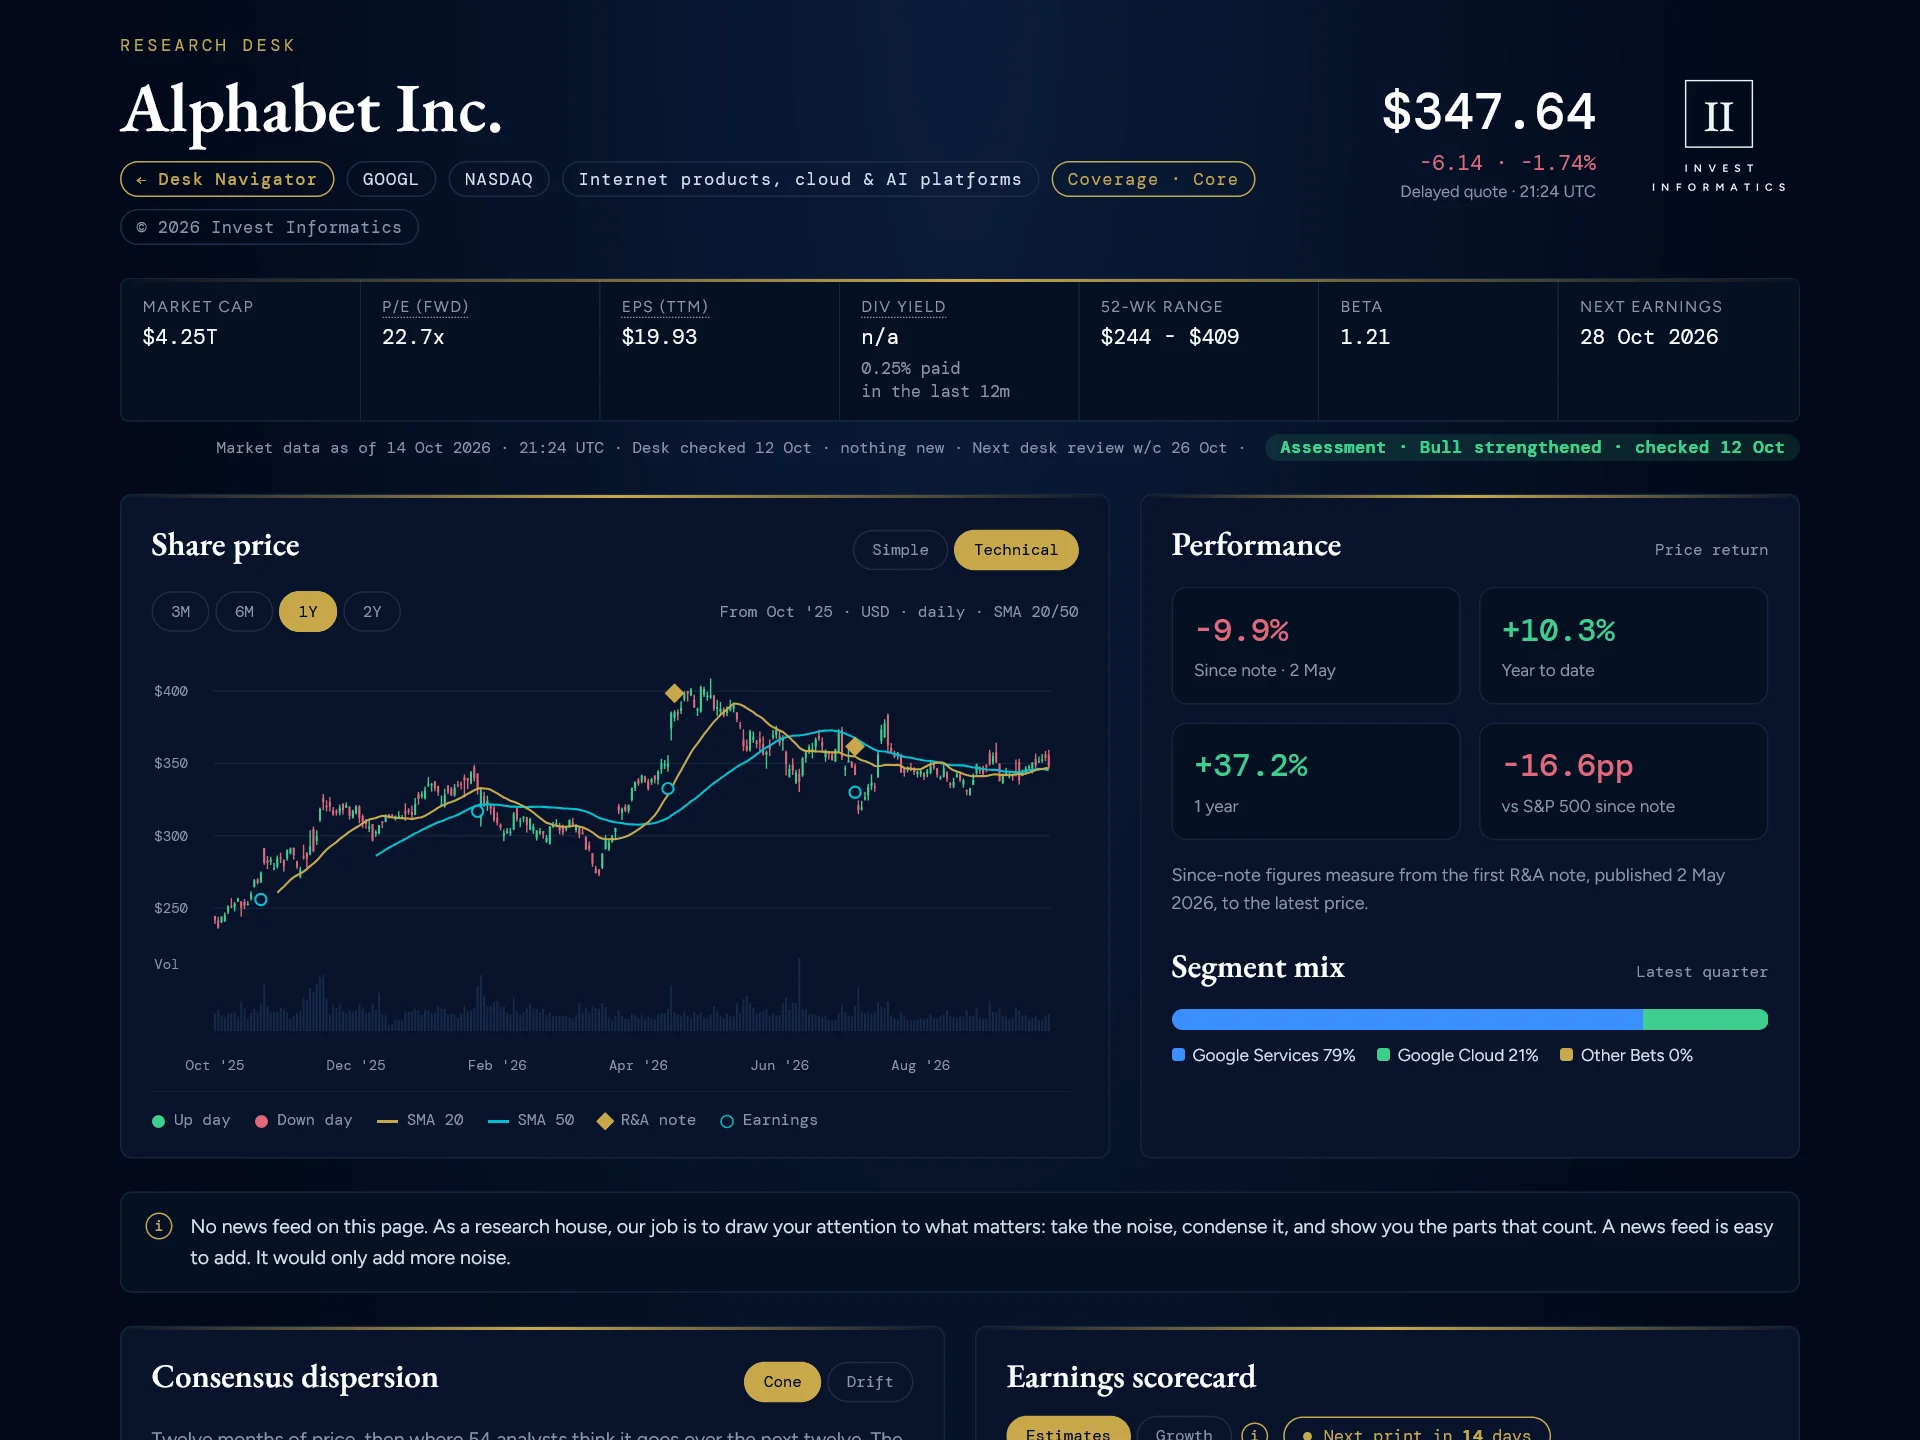
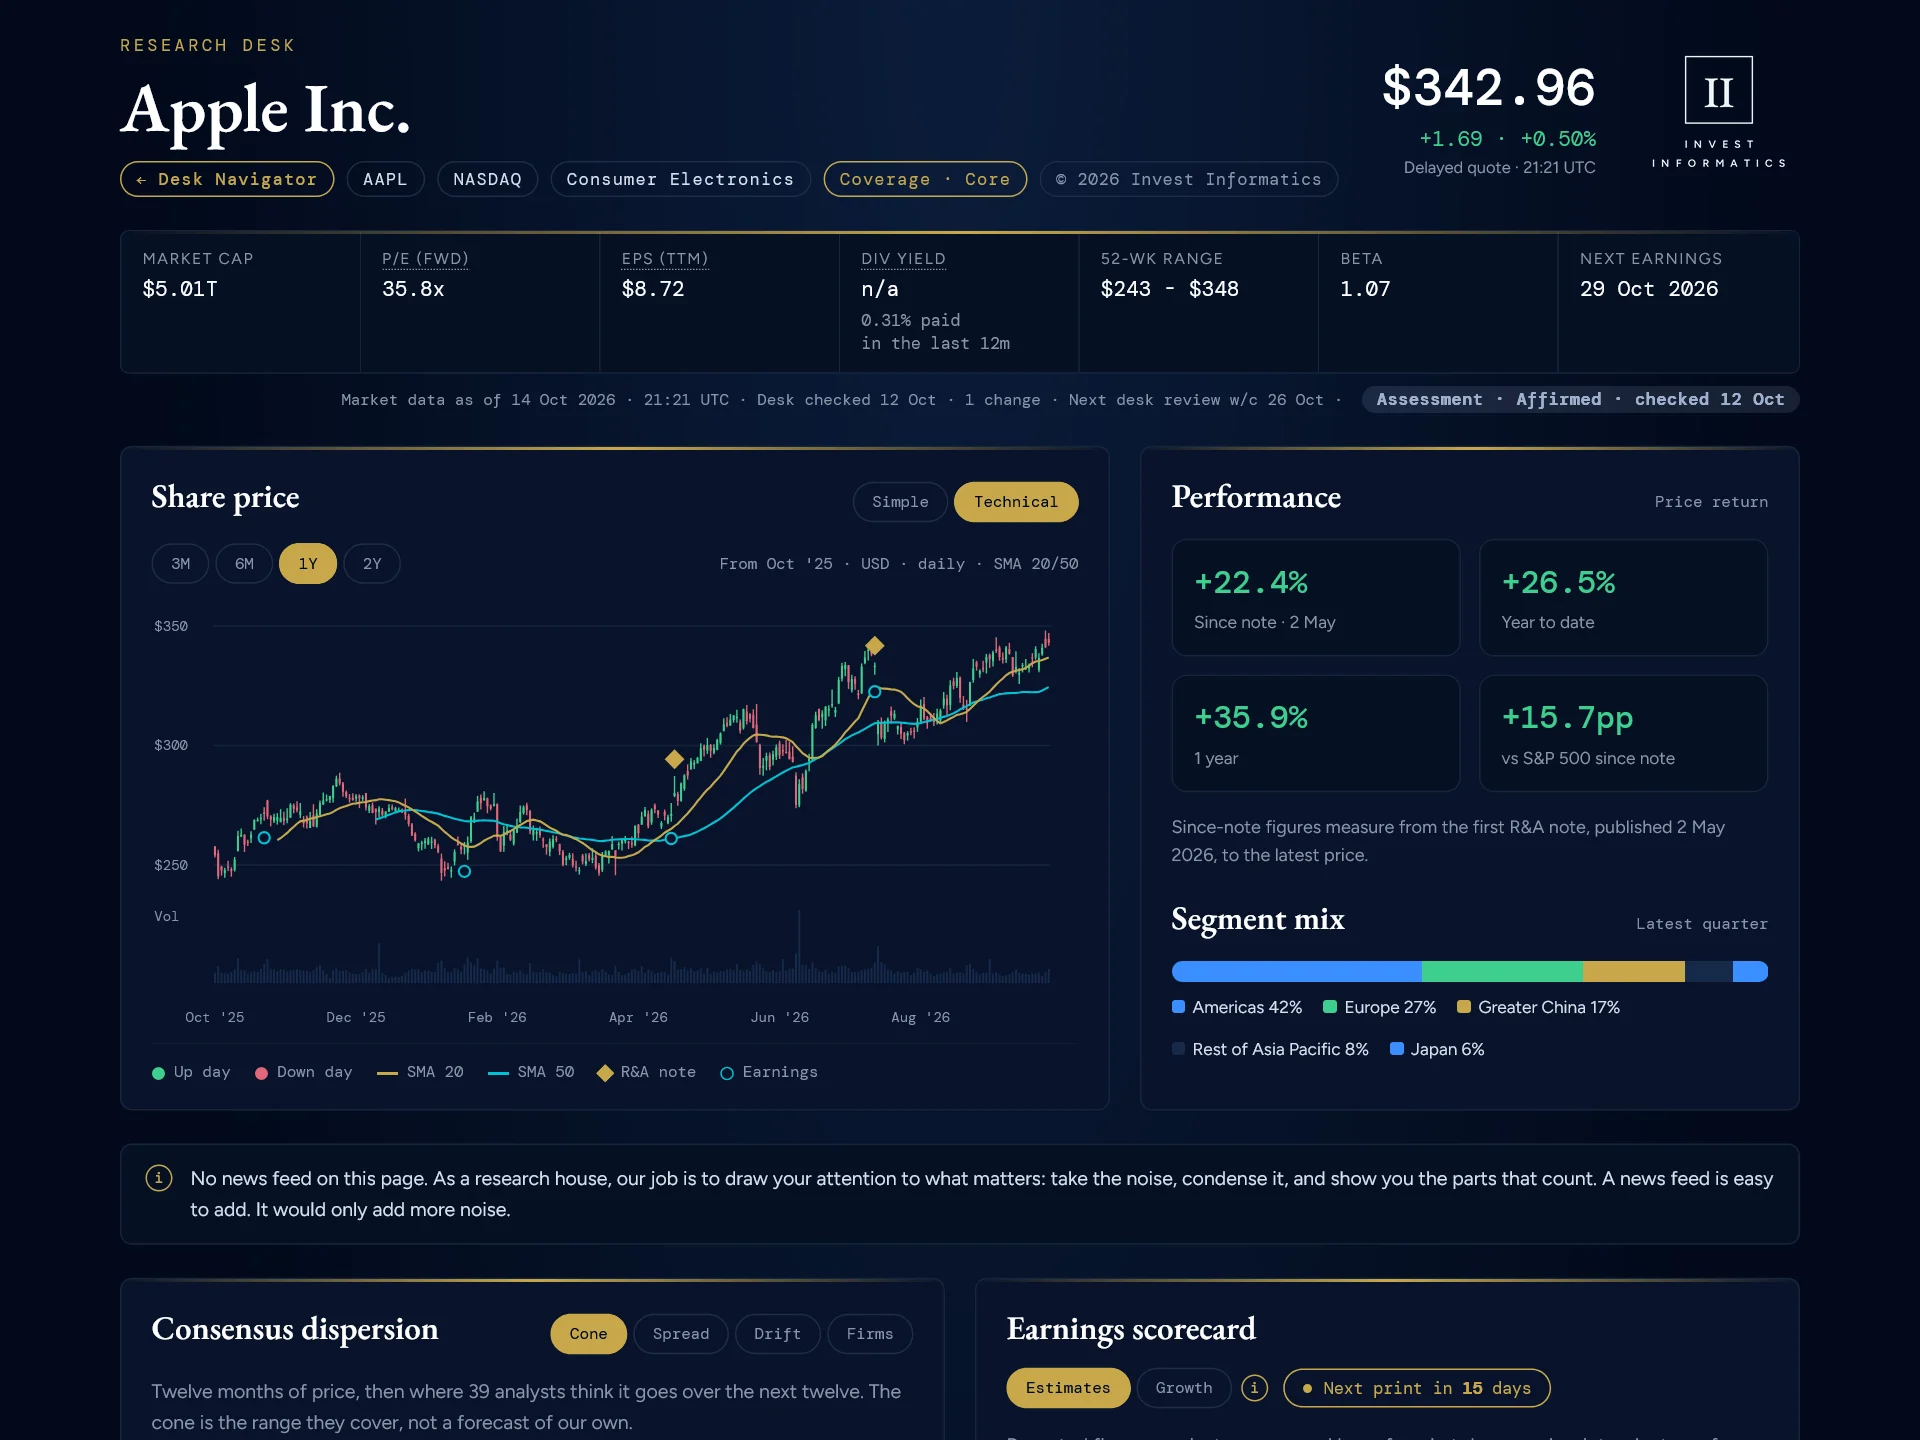
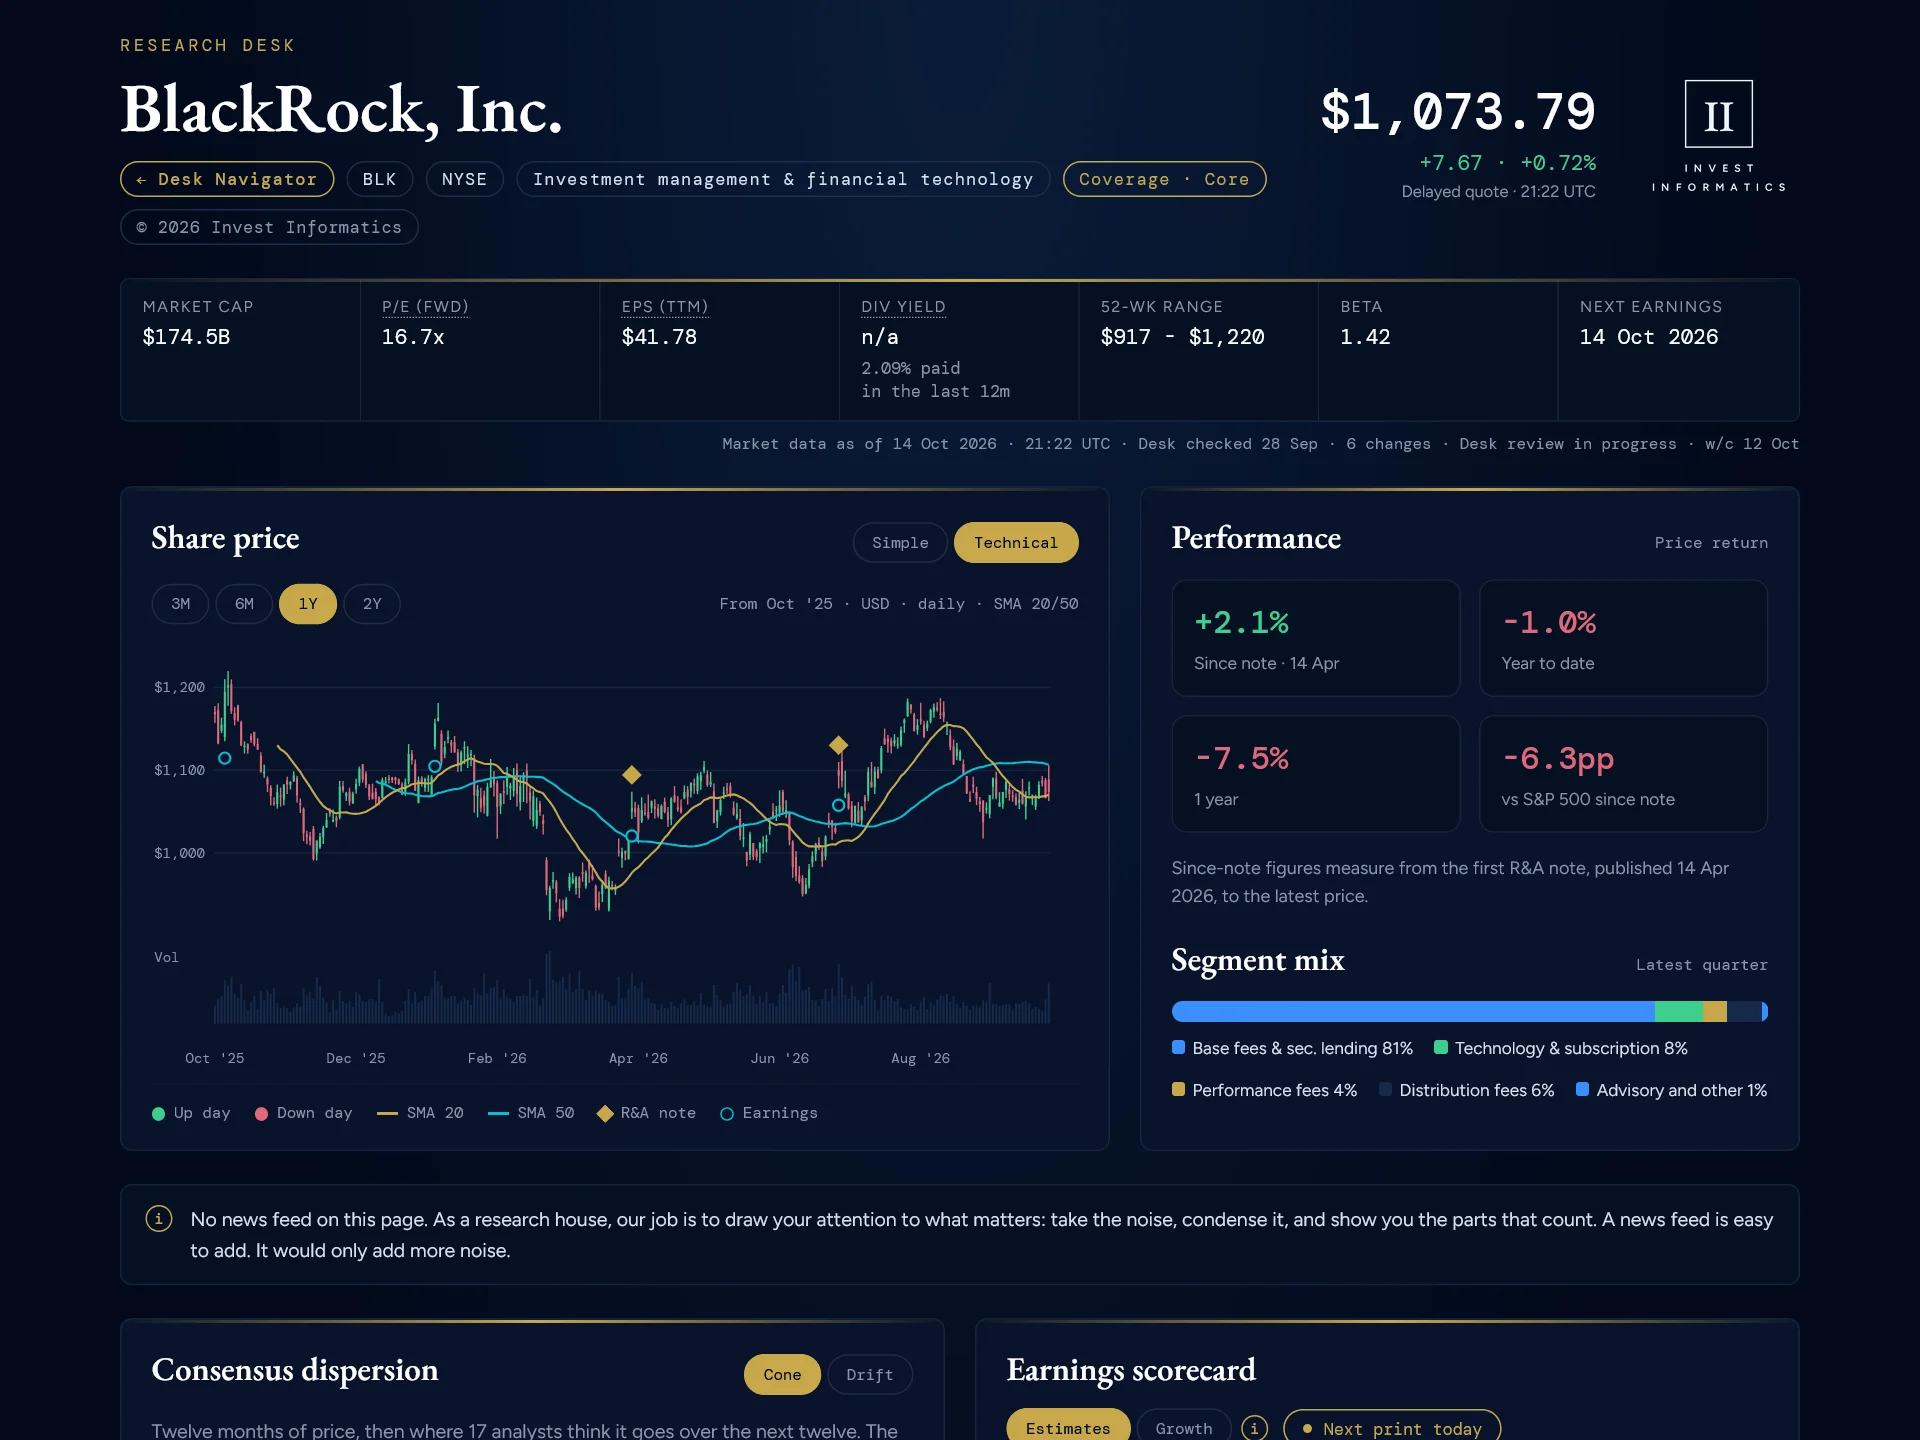
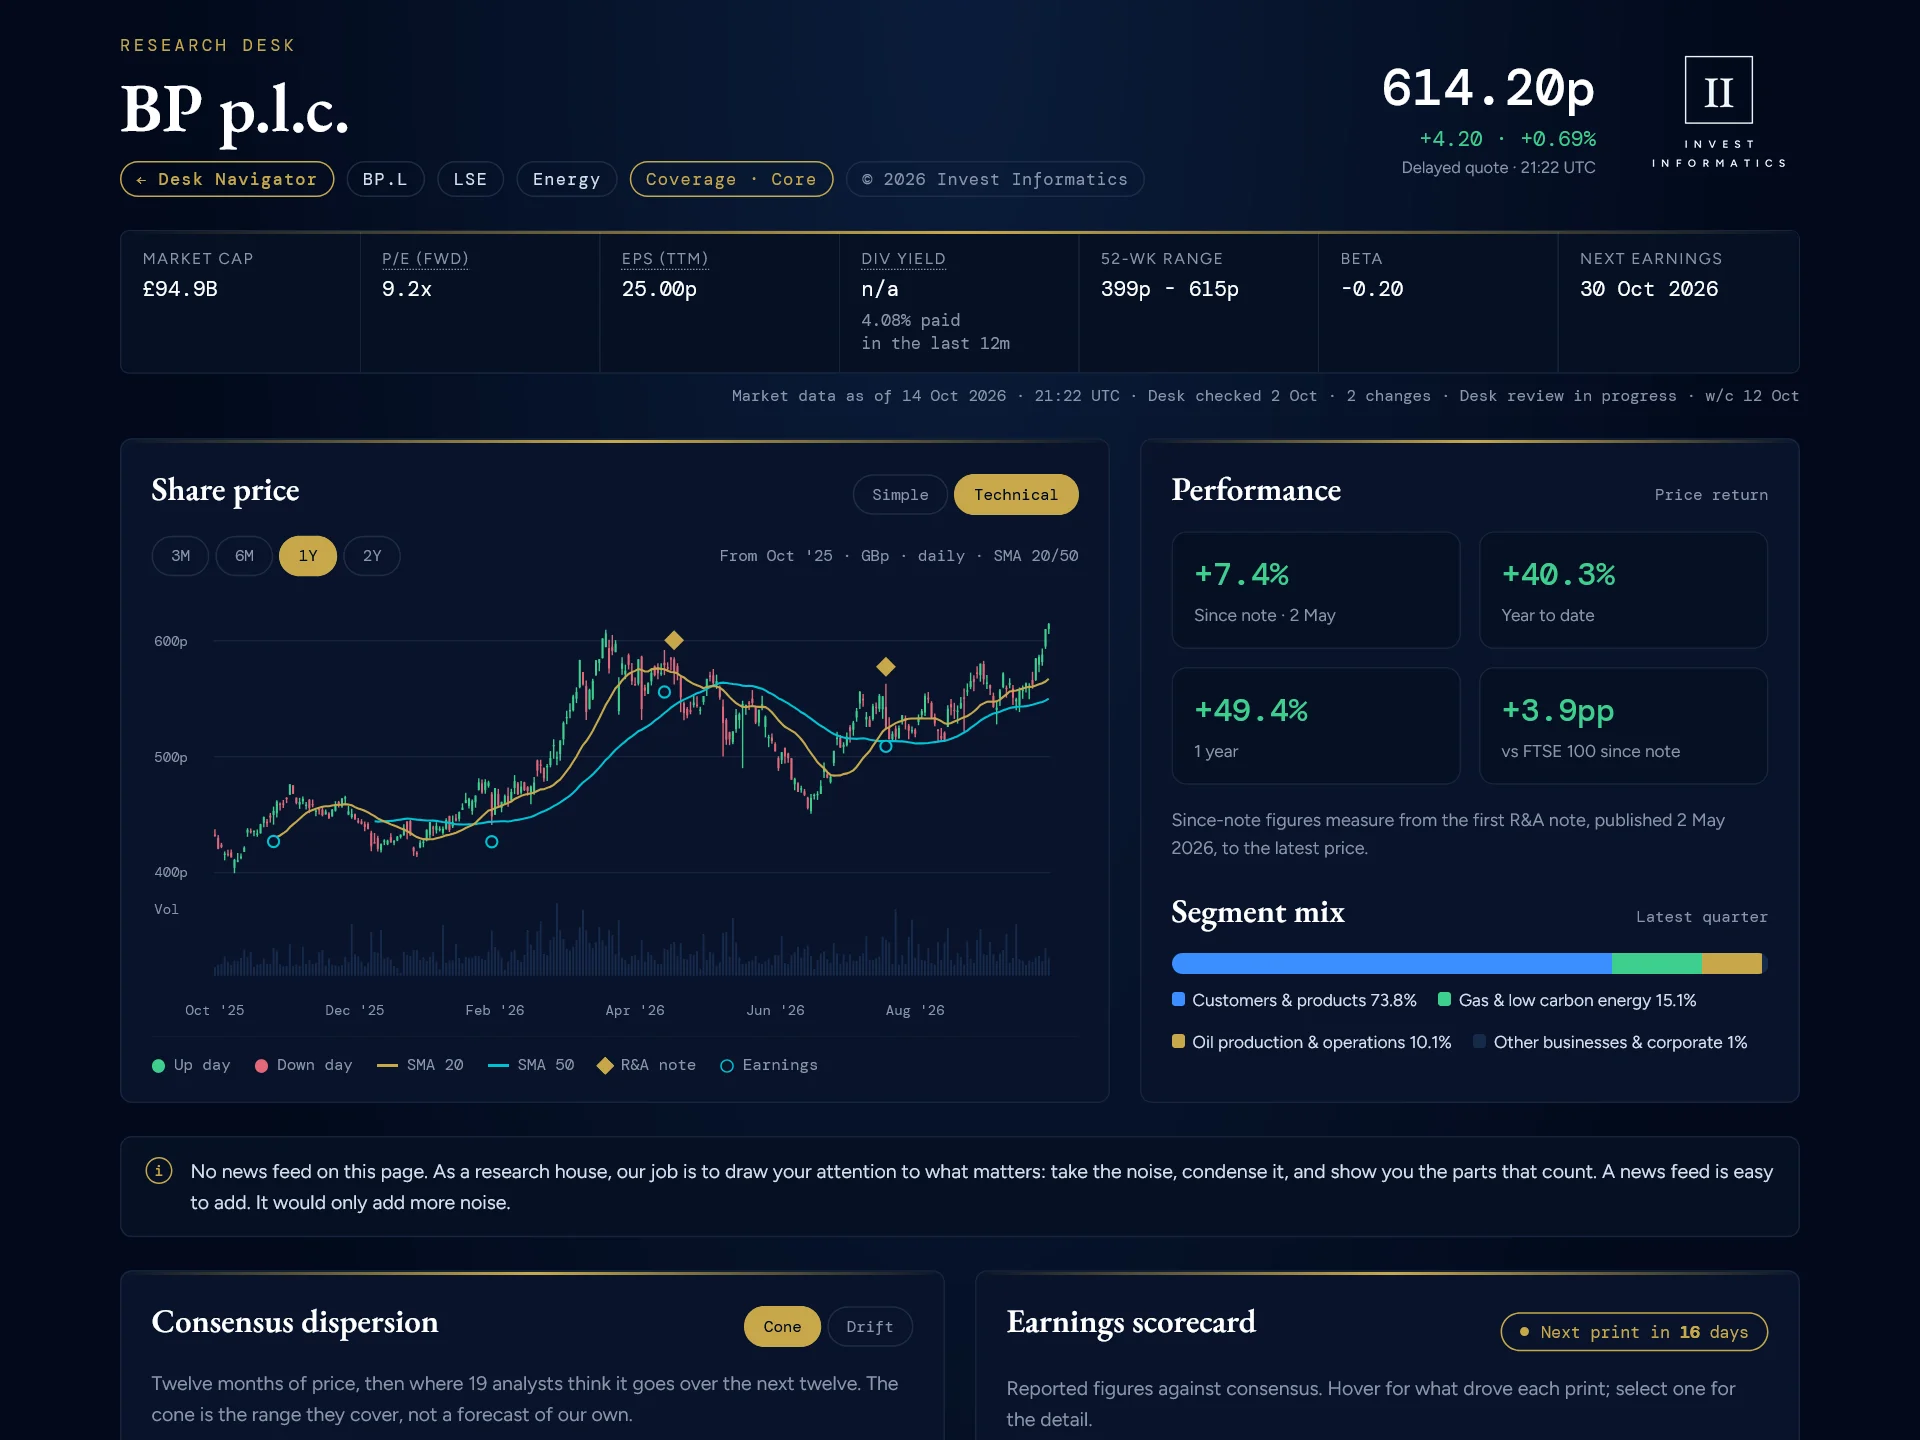
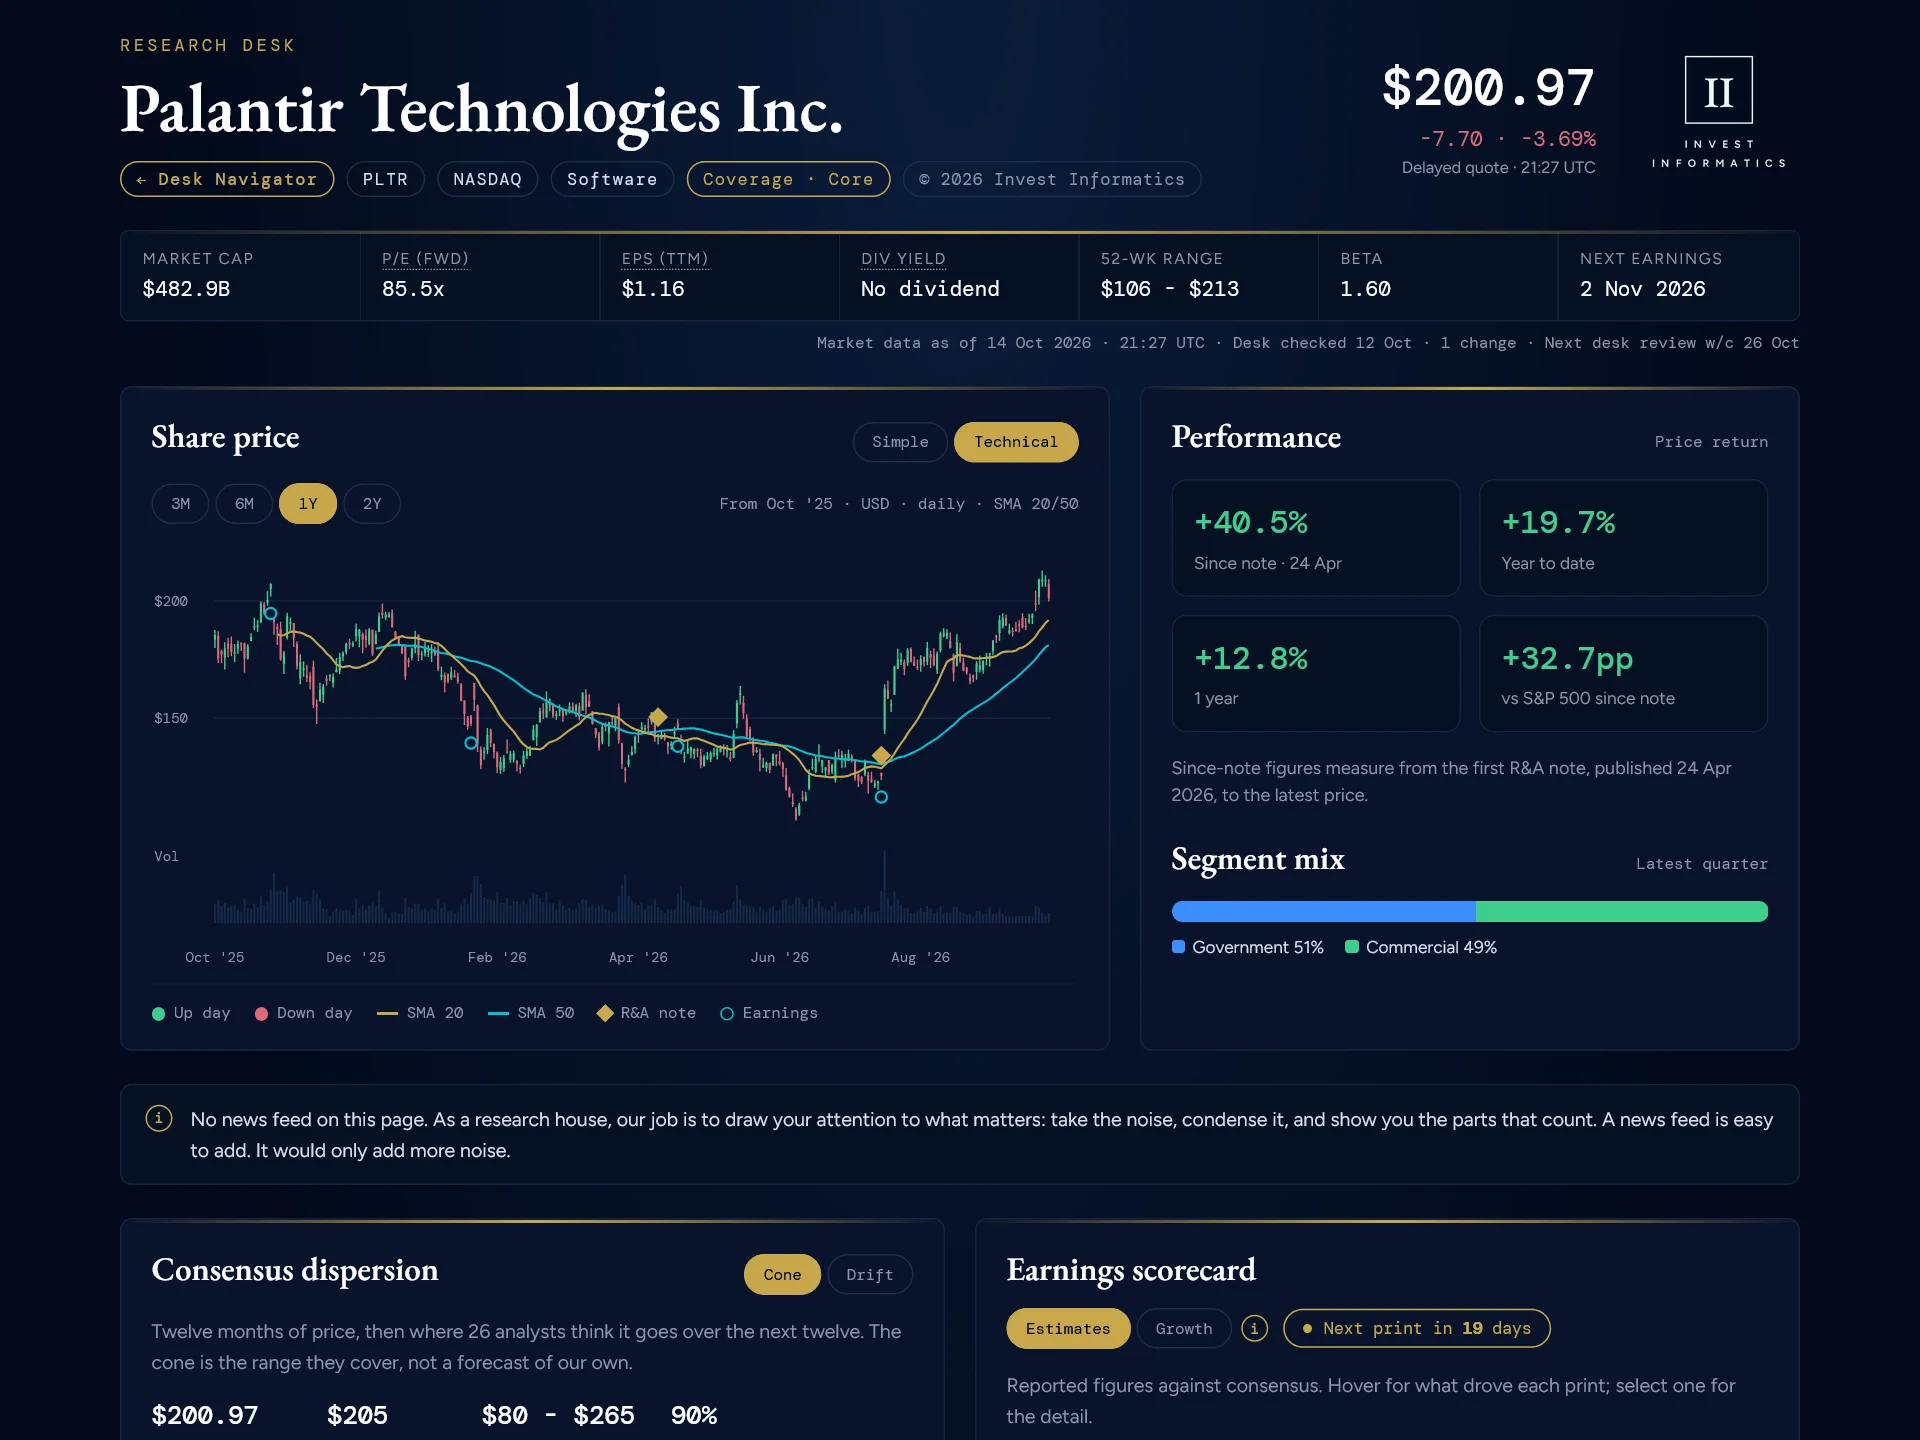
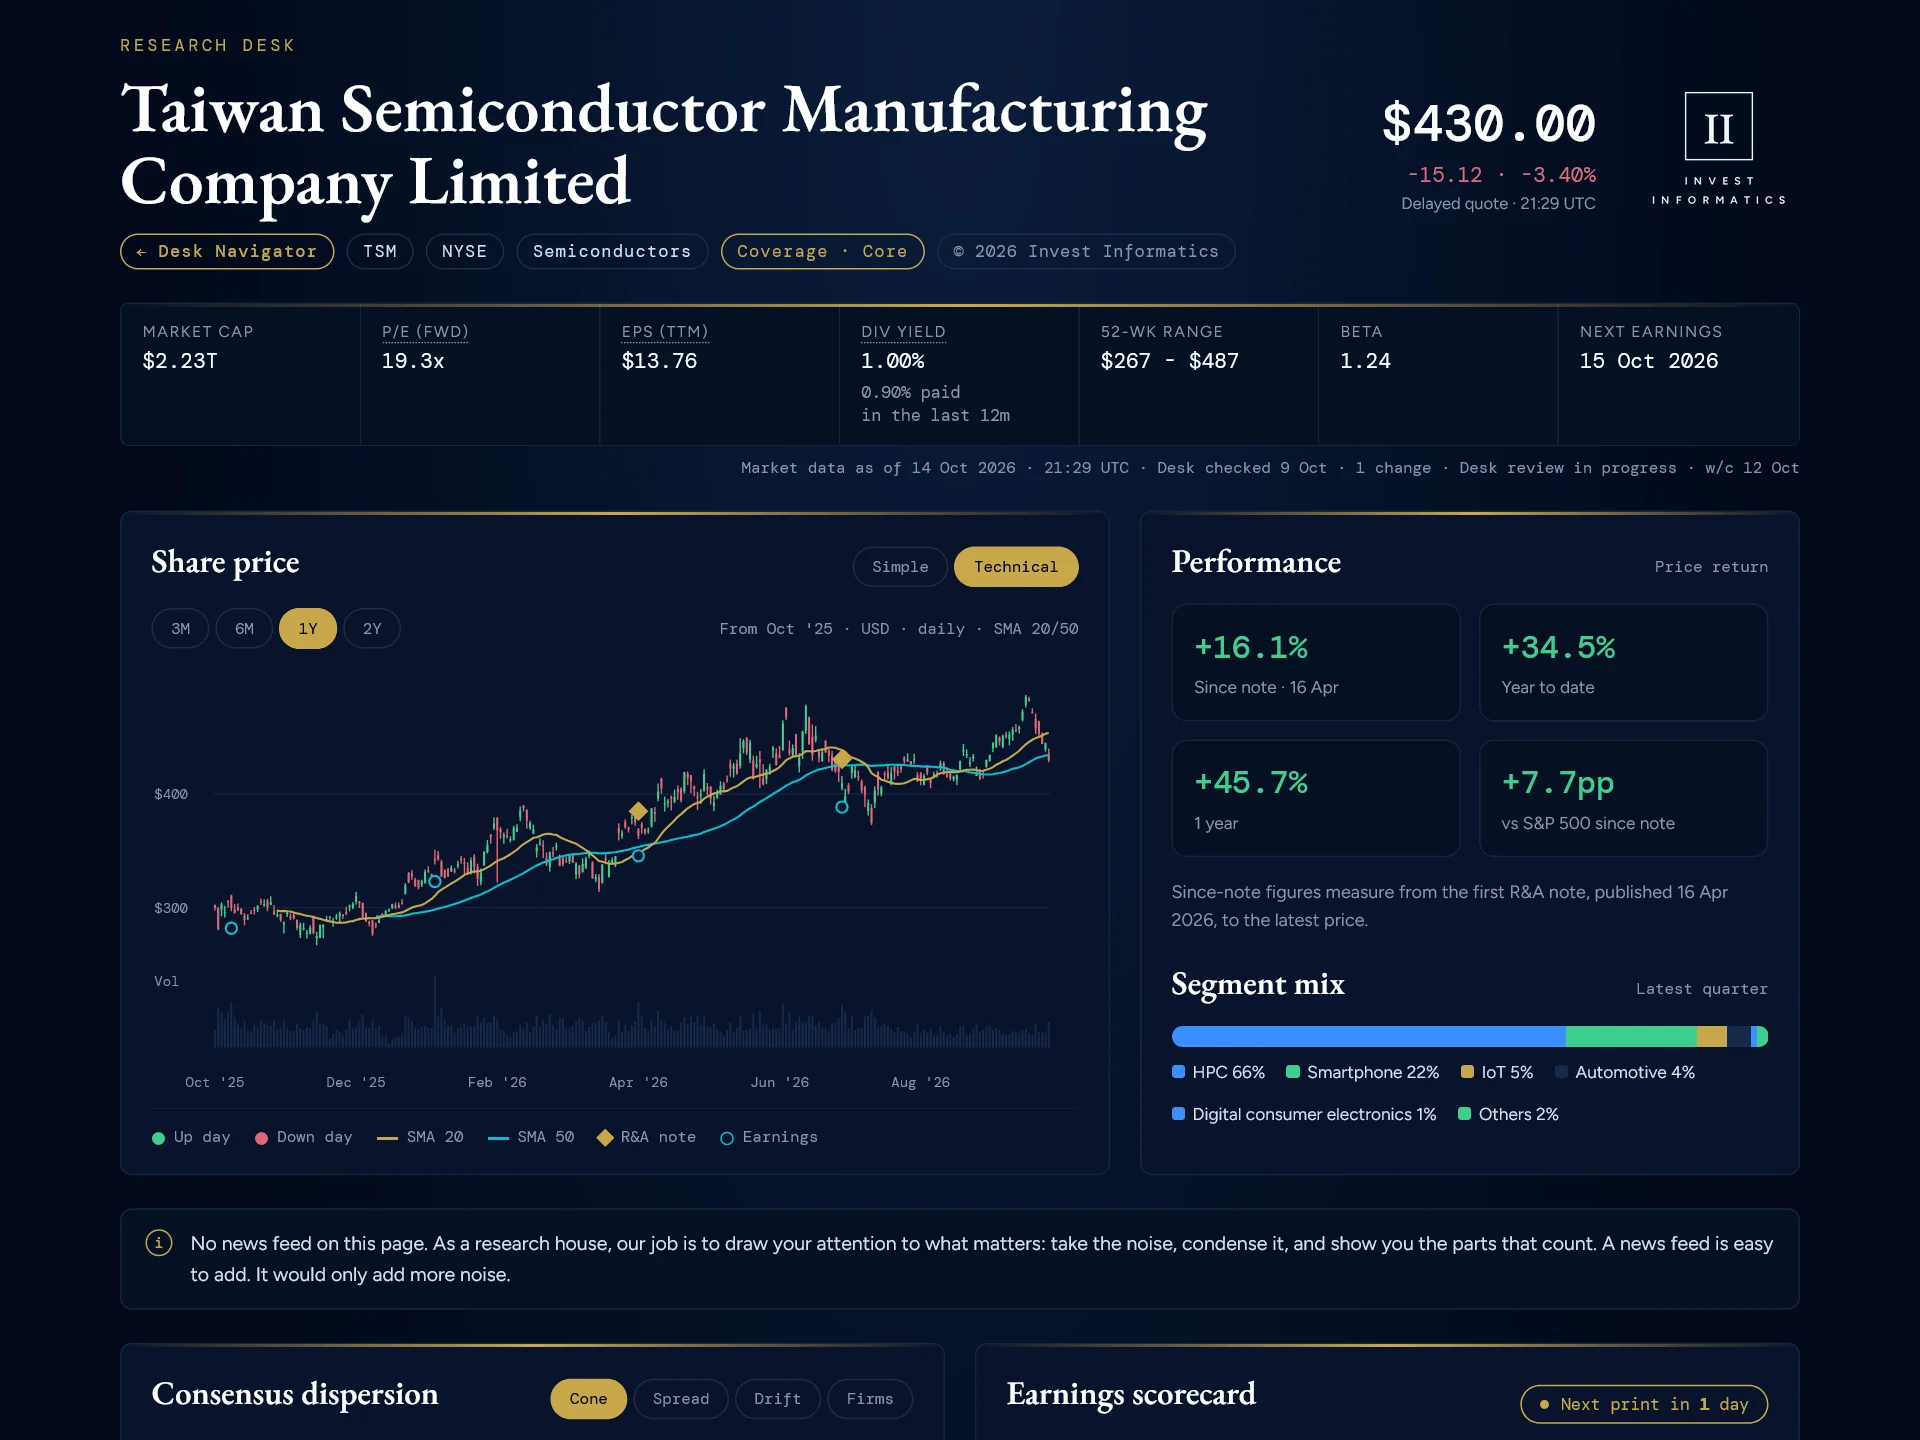
Below the top of each page sit the case for and against, the desk points, the scorecard and every edition of the research note, six here. Two hundred inside.
Open a profile page →Not one · Not two · Three!
We are so confident in our research and analysis that we are giving away three fully unlocked profile pages. All three are packed with analysis, and each one has our full Equity Research Notes embedded inside it that go further still.
NVIDIA
The most talked about, highest valued, most unprecedented earnings tech company out there. See what lies beneath the numbers.
See the full profile →Anthropic
Private coverage of the most watched IPO candidate. The funding ladder, the reported marks and the debate, both sides stated.
Full Profile Page →Micron
The memory cycle, measured print by print. Consensus, the earnings scorecard and the track record on one page.
Full Profile Page →Pictures are captures of the three live pages. Figures shown are point in time examples. Open each page for current data and the full note. Informational research, not a recommendation.
Three you can open.
Two hundred behind them.
Every company in the library was chosen, read and written up by a person, then revisited at every opportunity and never deleted. This is how much is on file today.
From one equity note in February to 392 editions on file in October. Earlier editions stay on file when a new one is written.
Inside Invest Informatics analysis
The R&A Note is the document at the centre of every profile page. Each one is written separately, on its own, by a person, with a single goal: find the facts and get them right.
Take our latest Apple note as a guided tour. Every note follows the same shape, so once you know where to look you can read any company in the library the same way. They are dense, and they reward the time you give them. We lay out the good and the bad and leave the decision to you.
 Published August 2026
1
Header & attribution
Standard for any research house. Brand, date, ticker, exchange, sector and fiscal calendar. You know exactly what you are reading and when it was written.
2
At a glance
The quarter in a single paragraph: what set a record, what held, what fell. Fifteen seconds in and you are ready for more.
3
The argument and the market
Our team’s favourite section. These lines frame the real debate and push you to think objectively, with a snapshot below showing where the share price sits against the analyst spread.
4
For and against
Both sides of the trade as clear points, each tagged for how solid the evidence is: reported, trend, management claim, or market view. Every one of them can affect your investment, for better or worse.
5
The data
A running sidebar of price, fundamentals, guidance, segment mix and balance-sheet figures, all taken from official filings. No opinions here, just figures you can check.
6
Events to monitor
Observable, dated, sourced upcoming events. We give you the calendar and the case either way on each one, so you have the full picture.
One company at a time. We read the filings, the release and the transcript, then write the note from those documents. Every figure in it can be traced back to something published, and where a claim is only a claim we say so on the line itself. When we get something wrong we correct it in the next edition and leave the old one on file.
Invest Informatics · The Living Library
One page per company.
Both cases stated.
Two hundred profile pages, each rebuilt after the earnings print. Every reward and risk point is dated and traced to its source, and earlier editions stay on file.
Everything starts at the source
The pipeline is comprehensive and disciplined.
Source
Every note begins with the company’s own filings. SEC 8-Ks, IR earnings releases, Companies House records. Nothing enters the pipeline that can’t be traced to official documents.
Quantify
Filings are broken down into a quantitative build. Reported actuals, adjusted figures, consensus estimates, all reconciled line by line. If GAAP and non-GAAP diverge, both are shown. Every figure is verified.
Analyse
The quantified data is stress-tested against history. Growth trends, margin trajectories, valuation ranges, peer comparisons. Broker actions cite the sell-side analyst by name and date. Unverified entries marked.
Optimise
Nothing in the model sits still. Coverage is revisited every cycle, and every week for the trigger report. Targets, ratings, and narratives retested against new filings, fresh broker calls, and observable developments.
Publish
The finished Research and Analysis ships in paper-style format with dual attribution, footer disclosures, and full content protection. Designed to be saved, cited, and returned to.
New evidence · New catalysts · Every week
Nothing in this library sits still. Every week the standing case on every covered company is retested against fresh evidence: what was reported, what management claimed, what the market merely believes. Each finding goes onto the profile page, dated and sourced, and every checkpoint we name is scored in the open when it lands.
Two markets · One research standard
Our coverage centres on a dynamic roster of over 200 companies, continuously updated each earnings season. Beyond the public markets, we track high-growth private and Pre-IPO businesses from their earliest stages.
Listed Equities
For the companies traded today.
- Built from SEC filings, IR releases, and primary disclosures
- Refreshed through every earnings cycle
- Broker actions verified by name, date, and source
- Coverage across US, UK, and European exchanges
Pre-IPO & Private
For the companies being built today.
- Frontier AI, biotech, and deep-tech growth companies
- Built from funding disclosures, public statements, and industry analysis
- Founder thesis, market thesis, and competitive landscape
- Same editorial standards